调用 echarts 美化你的图表
当年百度发出那份迁徙图,众人曾一度为之惊叹: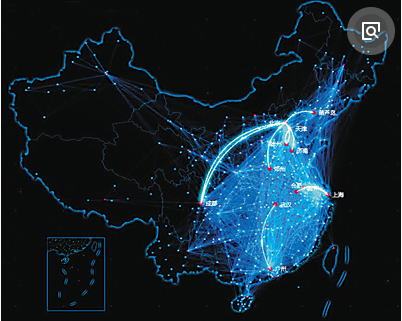
今天我们也来模仿那些屌炸天的图表。
首先pip安装步骤,安装好那些地图展示包文件:
pip install pyecharts
pip install echarts-countries-pypkg
pip install echarts-china-provinces-pypkg
pip install echarts-china-cities-pypkg
pip install echarts-china-counties-pypkg
pip install echarts-china-misc-pypkg
pip install pyecharts_snapshot
下面来看个简单的单例迁徙实例--从佛山向全国几个城市发散:
from pyecharts import GeoLines, Style, Page
style = Style(title_top="#fff",title_pos = "center",width=1200,height=600,background_color="#404a59")
style_geo = style.add(is_label_show=True,
    line_curve=0.2,
    line_opacity=0.6,
    legend_text_color="#eee",
    legend_pos="right",
    geo_effect_symbol="plane",
    geo_effect_symbolsize=15,
    label_color=['#a6c84c', '#ffa022', '#46bee9'],
    label_pos="right",
    label_formatter="{b}",
    label_text_color="#eee",)
def create_charts():
    page = Page()
    data_foshan = [["佛山", "上海"],["佛山", "南京"],["佛山", "北京"],["佛山", "兰州"],["佛山", "兰州"],["佛山", "大理"]]
    charts = GeoLines("业务扩张", **style.init_style)
    charts.add("从佛山出发", data_foshan,
    legend_selectedmode="single", **style_geo)
    page.add(charts)
    return page
create_charts().render(r'C:\Users\Administrator\Desktop\迁徙.html')
该代码将在我的本地桌面生成"迁徙.html"文件,我们打开它能看到如下动态图: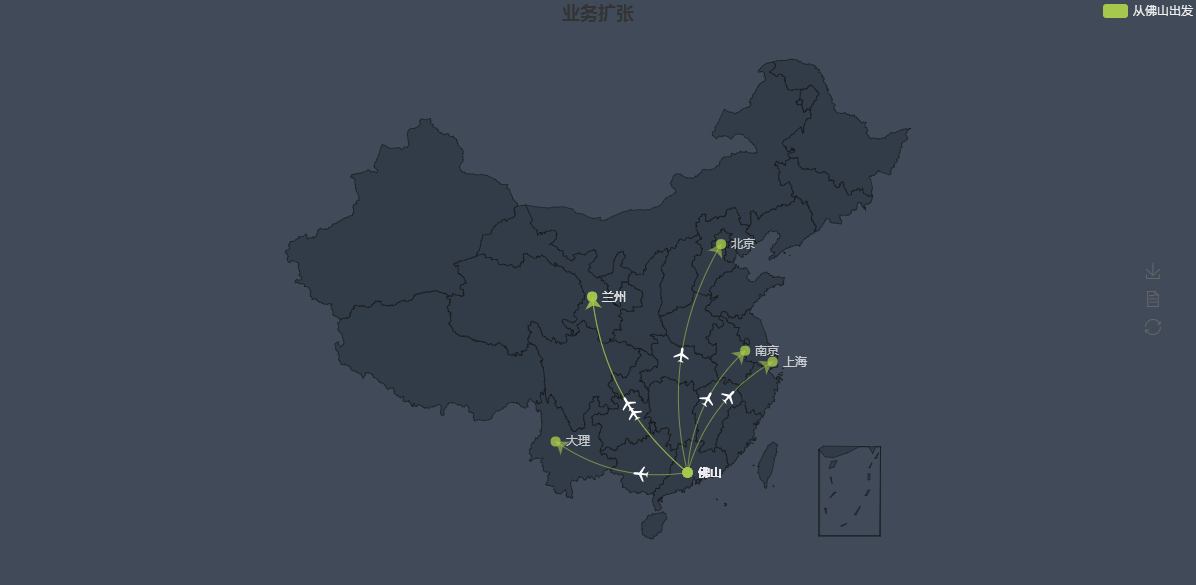
如果我们启用多例模式,只需稍加迁徙线路即可:
from pyecharts import GeoLines, Style, Page
style = Style(title_top="#fff",title_pos = "center",width=1200,height=600,background_color="#404a59")
style_geo = style.add(is_label_show=True,
    line_curve=0.2,
    line_opacity=0.6,
    legend_text_color="#eee",
    legend_pos="right",
    geo_effect_symbol="plane",
    geo_effect_symbolsize=15,
    label_color=['#a6c84c', '#ffa022', '#46bee9'],
    label_pos="right",
    label_formatter="{b}",
    label_text_color="#eee",)
def create_charts():
    page = Page()
    data_foshan = [["佛山", "上海"],["佛山", "南京"],["佛山", "北京"],["佛山", "兰州"],["佛山", "兰州"],["佛山", "大理"]]
    data_beijing = [["北京", "上海"],["北京", "佛山"],["北京", "南京"],["北京", "重庆"],["北京", "兰州"],["北京", "杭州"]]
    charts = GeoLines("业务扩张", **style.init_style)
    charts.add("从佛山出发", data_foshan, **style_geo)
    charts.add("从北京出发", data_beijing, **style_geo)
    page.add(charts)
    return page
create_charts().render(r'C:\Users\Administrator\Desktop\迁徙.html')
效果如下图: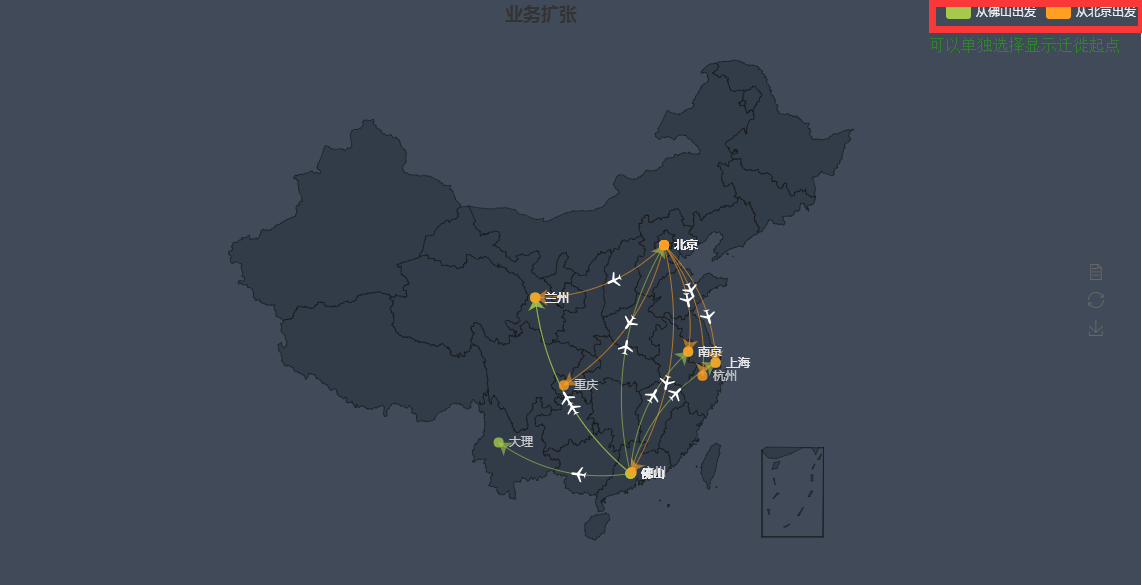
广东省地图:
from pyecharts import Map
value=[8,12,3,7,35,62,7,18,29,66,11,12,33,14,75,34,27,18,69,20,55,22]
attr=['广州市','佛山市','深圳市','汕头市','珠海市','韶关市','湛江市','清远市','肇庆市','清远市','茂名市','江门市','惠州市','汕尾市','河源市','阳江市','云浮市','东莞市','揭阳市','中山市','潮州市','梅州市']

map=Map("广东省数据展示",width=1200,height=600,title_color='#fff',title_pos='center',background_color='#404a59')
map.add("",attr,value,maptype='广东',visual_range=[0,80],is_visualmap=True,visual_text_color='#000')
map.render(r'C:\Users\Administrator\Desktop\绘制省份地图.html')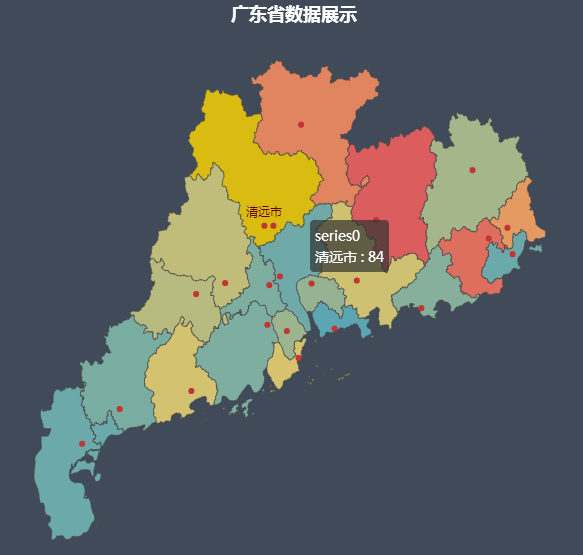
柱状图:
from pyecharts import Bar
attr = ["衬衫", "羊毛衫", "雪纺衫", "裤子", "高跟鞋", "袜子"]
v1 = [5, 20, 36, 10, 75, 90]
v2 = [10, 25, 8, 60, 20, 80]
bar = Bar("柱状图数据堆叠示例")
bar.add("商家A", attr, v1, is_stack=True)
bar.add("商家B", attr, v2, is_stack=True)
bar.render('C:\\Users\\Administrator\\Desktop\\a.html')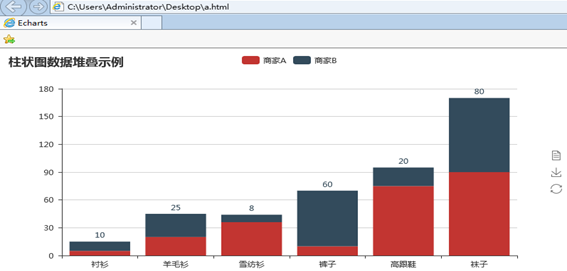
from pyecharts import Bar
attr = ["一月", "二月", "三月", "四月", "五月", "六月", "七月", "八月", "九月", "十月", "十一月", "十二月"]
v1 = [2.0, 4.9, 7.0, 23.2, 25.6, 76.7, 135.6, 162.2, 32.6, 20.0, 6.4, 3.3]
v2 = [2.6, 5.9, 9.0, 26.4, 28.7, 70.7, 175.6, 182.2, 48.7, 18.8, 6.0, 2.3]
bar = Bar("柱状图分析", "业务部2018年度业绩达成情况")
bar.add("业务一部", attr, v1, mark_line=["average"], mark_point=["max", "min"])
bar.add("业务二部", attr, v2, mark_line=["average"], mark_point=["max", "min"])
bar.render(C:\\Users\\Administrator\\Desktop\\b.html)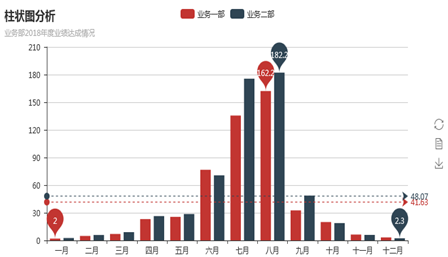
水滴球:
import pyecharts
lq = pyecharts.Liquid("水滴球")
lq.add("Liquid", [0.8, 0.5, 0.2], is_liquid_outline_show=False, is_liquid_animation=True)
lq.render("C:\\Users\\Administrator\\Desktop\\c.html")
仪表盘:
import pyecharts
gu = pyecharts.Gauge("仪表盘图")
gu.add("指标", "达标", 80)
gu.render("C:\\Users\\Administrator\\Desktop\\d.html")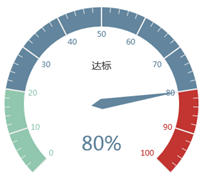
热力地图:
from pyecharts import Map
value =[2, 60, 2, 6, 80, 2, 5, 2, 1, 4, 5, 1,4, 1, 5, 2, 2, 5, 4, 1, 1, 10, 2]
attr =["安徽", "北京", "福建", "广东", "贵州", "海南", "河北", "河南", "黑龙江","湖北", "湖南",
 "吉林", "江苏", "辽宁", "山东", "山西", "陕西", "上海","四川", "天津", "云南", "浙江", "重庆"]
map=Map("各省数据分布", width=1200, height=600)
map.add("", attr, value, maptype='china', is_visualmap=True,visual_text_color='#000')
map.show_config()
map.render(r'C:\Users\Administrator\Desktop\热力.html')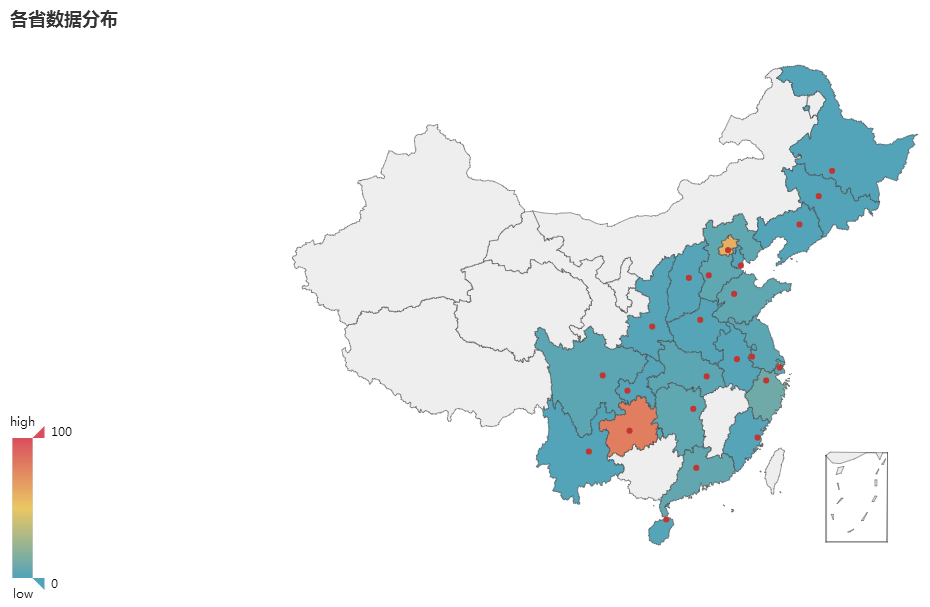
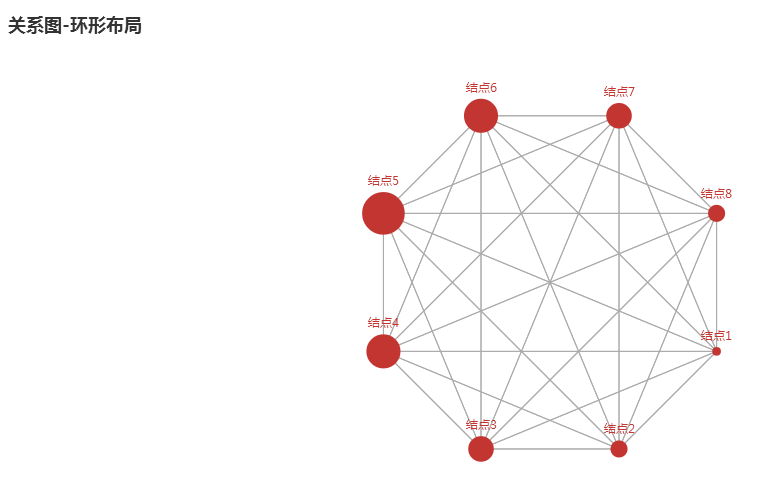
关系图:
from pyecharts import Graph, Page, Style
def create_charts():
    page = Page()
    style = Style(width=1100, height=600)
    nodes = [{"name": "结点1", "symbolSize": 10},
             {"name": "结点2", "symbolSize": 20},
             {"name": "结点3", "symbolSize": 30},
             {"name": "结点4", "symbolSize": 40},
             {"name": "结点5", "symbolSize": 50},
             {"name": "结点6", "symbolSize": 40},
             {"name": "结点7", "symbolSize": 30},
             {"name": "结点8", "symbolSize": 20}]
    links = []
    for i in nodes:
        for j in nodes:
            links.append({"source": i.get('name'), "target": j.get('name')})
    chart = Graph("关系图-力引导布局", **style.init_style)
    chart.add("", nodes, links, graph_repulsion=8000,line_color='#aaa')
    page.add(chart)
    chart = Graph("关系图-环形布局", **style.init_style)
    chart.add("", nodes, links, is_label_show=True, graph_repulsion=8000,
              graph_layout='circular', label_text_color=None)
    page.add(chart)
    return page
create_charts().render(r'C:\Users\Administrator\Desktop\关系.html')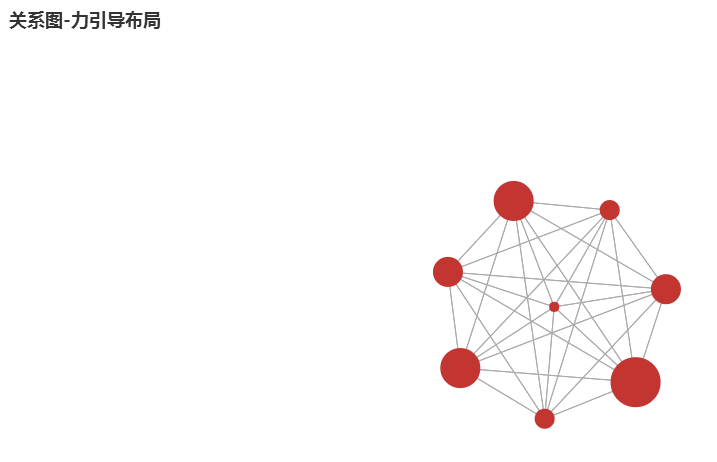
参考:Jupyter Notebook Viewer
http://nbviewer.jupyter.org/github/pyecharts/pyecharts-users-cases/blob/master/notebook-users-cases/notebook-user-cases.ipynb
道高一尺 魔高一丈
https://pbihub.cn/users/44
自由转载-非商用-非衍生-保持署名(创意共享3.0许可证)

