关于 “FC 26 monedas comprar Visité Buyfc26coins.com. ¡Fantástico! Mi nueva tienda favorita..OqgD” 的搜索结果, 共 504 条


请教大神,如何实现附图的并列饼图及并列条形图 by Dan Dan

https://pbihub.cn/qa/414 2019-03-26 ⋅ 2865 ⋅ 0 ⋅ 2
如何实现这样的并列呢? ![file](https://pbihub.cn/uploads/images/201903/26/805/Fs71FG5JF4.png) ![file](https://pbihub.cn/uploads/images/201903/26/805/eiaEONfjOJ.png)

LOOKUPVALUE 函数的使用姿势 by PowerPivot工坊 PowerPivot工坊

https://pbihub.cn/blog/415 2019-03-26 ⋅ 5872 ⋅ 1 ⋅ 1
![](http://p1.pstatp.com/large/pgc-image/f89631124ea74e808450d00703d504d9) 工坊的小伙伴们大家好,在实际工作中,特别是Excel中,经常需要使用VLOOKUP函数根据索引来查找出一些其他的列。 那么,在Power BI中,类似的函数是什么呢? 它就是我们今天的主角...

对 List.TransformMany 的浅显理解 by eXcellent eXcellent

https://pbihub.cn/blog/422 2019-03-29 ⋅ 4160 ⋅ 2 ⋅ 1
该函数的语法是: List.TransformMany( list, (each_in_list)=> function_1, (each_in_list, each_in_list_2)=> function_2) 其语意是:先对第一参数list里的每个元素 each_in_list作为参数代入function_1里去运算,得到另一个列list_2,也就是第二参数。这个过程几乎...

有没有类似 Countifs 的跨表多条件计数的 Dax 函数 by Henry Henry

https://pbihub.cn/qa/432 2019-04-02 ⋅ 2847 ⋅ 0 ⋅ 2
A 表 PERSON_NUM STARTDTM ENDDTM 275660 12/03/2018 08:12 12/03/2018 08:16 141765 12/03/2018 08:12 12/03/2018 20:02 267058 12/03/2018 08:12 12/03/2018 20:02 235740 12/03/2018 08:12 12/03/2018 20:02 B表 Date Dat...

组合产品销售模型分析(上篇)——新维度表的构建 by PowerPivot工坊 PowerPivot工坊

https://pbihub.cn/blog/434 2019-04-04 ⋅ 3756 ⋅ 1 ⋅ 0
![](http://p9.pstatp.com/large/pgc-image/fa0dad649723446381fc4819e156022d) Hi~工坊的小伙伴们大家好! 今天我们将进行组合产品销售模型分析,文章分为上下两篇,今天发布的是上篇。 <br/> ## **情景假设** > 某商店进行促销活动,对现有商品进行组合...

组合产品销售模型分析(下篇) by PowerPivot工坊 PowerPivot工坊

https://pbihub.cn/blog/436 2019-04-08 ⋅ 2719 ⋅ 0 ⋅ 0
![](http://p9.pstatp.com/large/pgc-image/fa0dad649723446381fc4819e156022d) 嗨~各位小伙伴,在昨天的推送中,我们发布了组合产品销售模型分析(上篇),交代了组合产品的业务情景,并且为了实现该情境,构建了一个新的产品表,里面包括了实际用于出售的产品,销...

可视化图表——Data Bar KPI Visual by PowerPivot工坊 PowerPivot工坊

https://pbihub.cn/blog/445 2019-04-12 ⋅ 2785 ⋅ 0 ⋅ 0
![](http://p1.pstatp.com/large/pgc-image/f89631124ea74e808450d00703d504d9) 工坊的小伙伴们大家好,最近小编发现一个比较简单直观的KPI展示图表——KPI Visual,它是用一个带颜色的条形图指示向目标前进的进度。 KPI Visual的设计采用的原则是:尽可能占用最小的...

如何使用 Power Query 筛选数字列的最大值 by PowerPivot工坊 PowerPivot工坊

https://pbihub.cn/blog/447 2019-04-15 ⋅ 3041 ⋅ 0 ⋅ 0
![](http://p1.pstatp.com/large/pgc-image/f89631124ea74e808450d00703d504d9) 
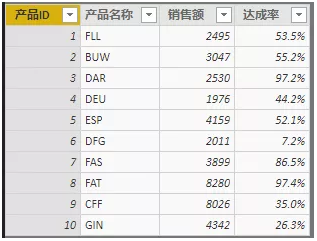
在Power Query中,我们经常会需要做各种筛选。现有如下场景: 在使用Power Query时,我们想将下表中报告金额最大的报告ID筛选出来, ![file](https://pbihub.cn/uploads/images/201...

根据入库时间和出库时间计算库存 by PowerPivot工坊 PowerPivot工坊

https://pbihub.cn/blog/448 2019-04-16 ⋅ 3080 ⋅ 2 ⋅ 1
![](http://p1.pstatp.com/large/pgc-image/f89631124ea74e808450d00703d504d9) 工坊的小伙伴们大家好,我们经常遇到一种分析场景:根据每一条产品的入库时间和出库时间计算某个时点的库存数量。今天我们将专门解决这个问题。 ## **01 数据准备** 库存示意数...

如何在度量值中实现 EARLIER 的效果 by Moonstar333 Moonstar333

https://pbihub.cn/qa/450 2019-04-16 ⋅ 2776 ⋅ 0 ⋅ 0
MCorSession = MINX( FILTER(ALLSELECTED('Session'),'Session'[WK]="HD12"), 'Session'[MAX session] ) 该度量值计算只针对指定的一个WK,如何将该计算应用于‘Session’表所有的WK中?像EARLIER实现的效果,但是ERALIER只针对计算列

DAX 函数答疑-根据入库时间和出库时间计算库存(续) by PowerPivot工坊 PowerPivot工坊

https://pbihub.cn/blog/451 2019-04-17 ⋅ 2500 ⋅ 1 ⋅ 0
![](http://p1.pstatp.com/large/pgc-image/f89631124ea74e808450d00703d504d9) 工坊的小伙伴们大家好,小编整理文章留言时发现《根据入库时间和出库时间计算库存》一文下面留言很多,其中有两个代表性留言如下: > ### **Q1** > 这个度量值计算方式对于工业来说也...

DAX 函数:听说你想用度量值做切片器? by PowerPivot工坊 PowerPivot工坊

https://pbihub.cn/blog/453 2019-04-18 ⋅ 6252 ⋅ 6 ⋅ 2
![](http://p1.pstatp.com/large/pgc-image/f89631124ea74e808450d00703d504d9) 某一天,有客户提出,要用计算的指标作为切片器,选什么出什么,小编从心里翻了个白眼,这不太可能呀! ![file](https://pbihub.cn/uploads/images/201904/18/125/2GszScRHyg.png)...

power BI 编辑页面偏移无法完全显示 by cathyliujj cathyliujj

https://pbihub.cn/qa/454 2019-04-19 ⋅ 2897 ⋅ 0 ⋅ 0
![file](https://pbihub.cn/uploads/images/201904/19/843/YjJiR6tCMI.png) 编辑页面右下偏移,无法完整显示右半边的可视化、筛选器等,烦请大家帮忙怎么将编辑页面归位,不偏移,谢谢!

Power BI 可视化:超实用的多个小折线组合图 by PowerPivot工坊 PowerPivot工坊

https://pbihub.cn/blog/455 2019-04-19 ⋅ 4074 ⋅ 1 ⋅ 0
![](http://p1.pstatp.com/large/pgc-image/f89631124ea74e808450d00703d504d9) 嗨~各位坊友周五好呀! 今天小编来和大家分享一个可视化视图Small Multiple Line Chart,先来看下效果: ![file](https://pbihub.cn/uploads/images/201904/19/125/S2CPOa82AC.png)...

如何使用 Power Pivot 进行模糊匹配 by PowerPivot工坊 PowerPivot工坊

https://pbihub.cn/blog/458 2019-04-23 ⋅ 2685 ⋅ 0 ⋅ 0
![](http://p1.pstatp.com/large/pgc-image/f89631124ea74e808450d00703d504d9) 
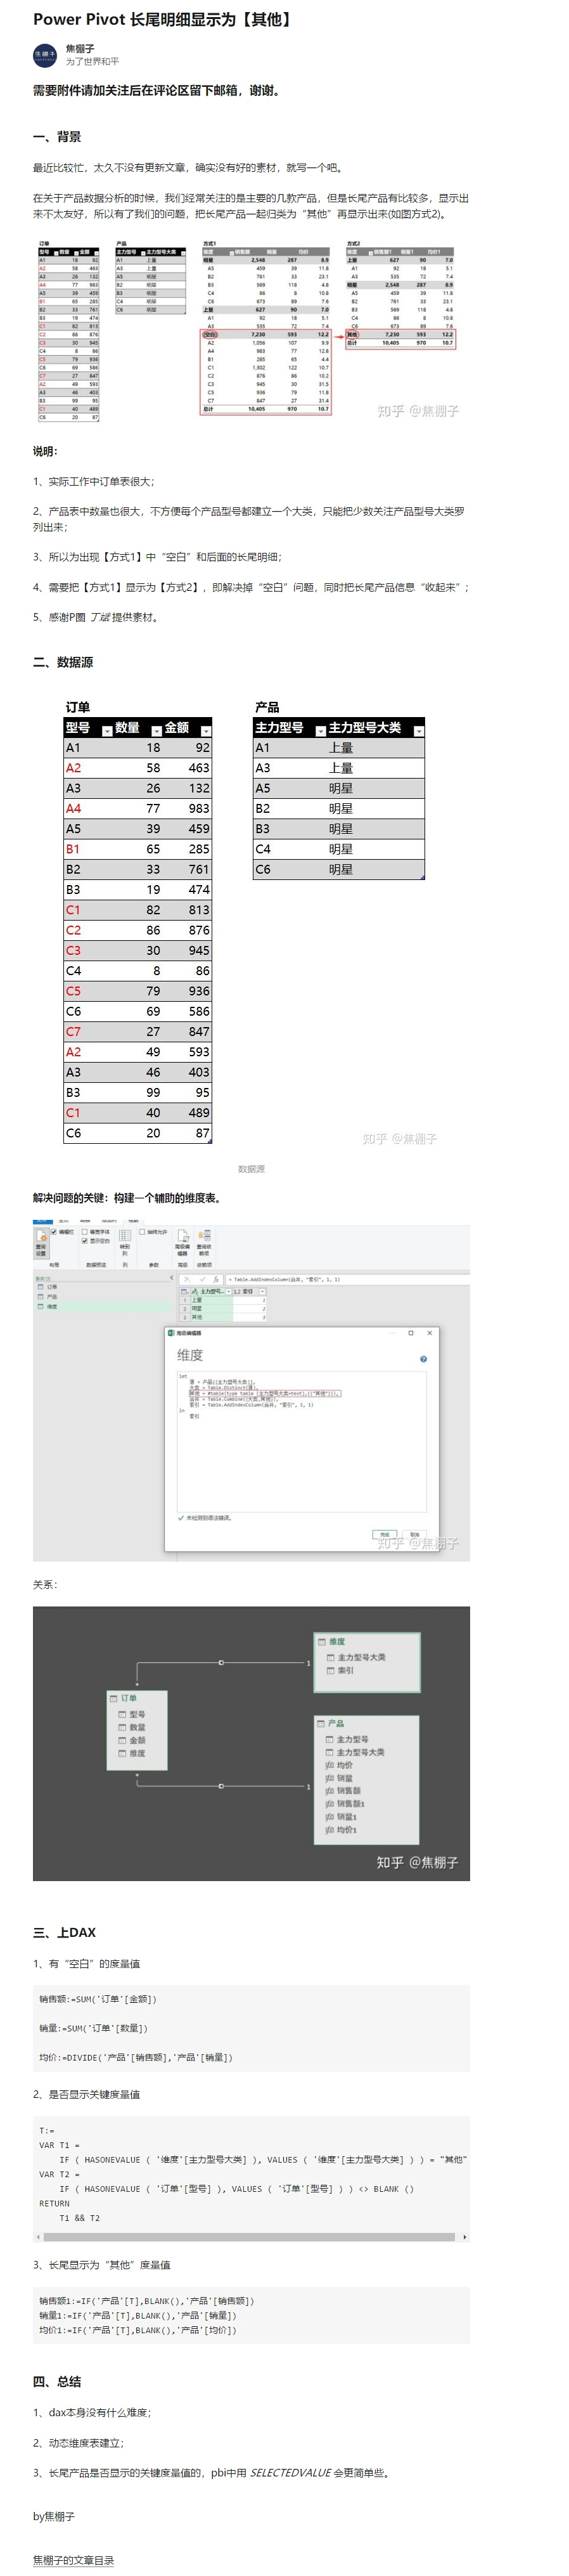
之前在《使用Power Query进行模糊匹配》一文中我们讨论了如何在Power Query中进行模糊匹配,今天我们来讨论下在Power Pivot中的模糊匹配。 还是之前的案例,图1为产品表,图2为颜色...

PowerBi 中调用 Web 服务时重复请求问题与解决方法 by Ntt docomo Ntt docomo

https://pbihub.cn/blog/460 2019-04-23 ⋅ 2938 ⋅ 2 ⋅ 1
原贴:https://blog.crossjoin.co.uk/2019/03/26/power-bi-caching-parallelism-and-power-query-refresh-performance/ 首先,在flow中创建一个简单的自定义的API,收到请求后返回Hello:
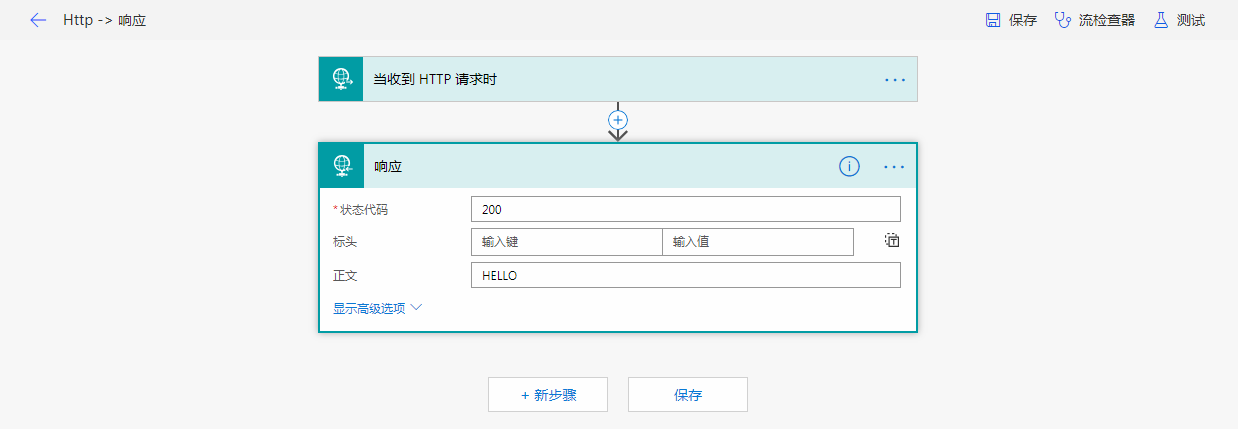
 ![file](https://pbihub.cn/uploads/images/201904/23/29/iPJPaTnoKl.png) 在Powe...

Excel 调用数据模型,可以这样做! by PowerPivot工坊 PowerPivot工坊

https://pbihub.cn/blog/465 2019-04-25 ⋅ 5492 ⋅ 6 ⋅ 2
![](http://p1.pstatp.com/large/pgc-image/f89631124ea74e808450d00703d504d9) 行政或财务的小伙伴们有没有经常需要填写类似这样的一个表单呢?
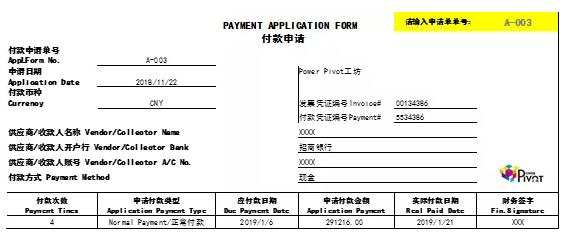
 ![file](https://pbihub.cn/uploads/images/201904/25/125/PeupQRIflb.png) 一般基础数据像下面这样: ![file...

请教,PowerBI 趋势图 by Dan Dan

https://pbihub.cn/qa/466 2019-04-26 ⋅ 2835 ⋅ 0 ⋅ 2
![file](https://pbihub.cn/uploads/images/201904/26/805/dv5PXZxoHg.png) 
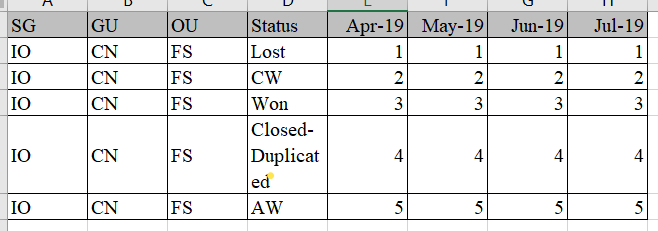
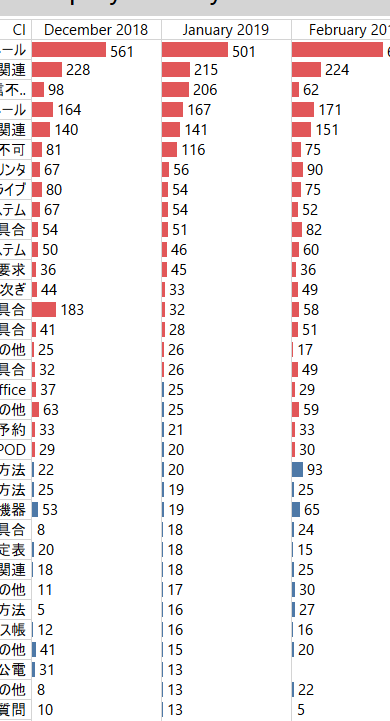
有如图的数据,每个月的数据是一列,在PowerBI里 如何作成趋势图?

Power Pivot 长尾明细显示为【其他】 by 焦棚子 焦棚子

https://pbihub.cn/blog/468 2019-04-26 ⋅ 2458 ⋅ 1 ⋅ 0
**传送门** https://jiaopengzi.com/355.html *如果代码看不全,通过传送门看原文。* ![file](https://pbihub.cn/uploads/images/201904/26/59/RfYUXYcZnP.png)

Power BI 区域分析可视化:地图一定不能少 by PowerPivot工坊 PowerPivot工坊

https://pbihub.cn/blog/472 2019-04-29 ⋅ 7181 ⋅ 3 ⋅ 0
![](http://p1.pstatp.com/large/pgc-image/f89631124ea74e808450d00703d504d9) 区域分析过程中,在想了解全国或者全球各地域业务分布情况时,地图可视化分析越来越多的被应用,并且PowerBI自带气泡地图在不断地优化后已成为易上手而且视觉体验又不错的可视化视觉。...

Power BI 中的编辑交互 by PowerPivot工坊 PowerPivot工坊

https://pbihub.cn/blog/481 2019-05-08 ⋅ 2550 ⋅ 0 ⋅ 0
![](http://p1.pstatp.com/large/pgc-image/f89631124ea74e808450d00703d504d9) Hi~各位坊友,今天我们将来介绍一下Power BI中的编辑交互功能! 如下图是一张教师信息表,记录教师的ID、姓名、所属地区以及学历: ![file](https://pbihub.cn/uploads/images/2019...

Power Pivot 针对表筛选的函数及差异 by 逍遥之 逍遥之

https://pbihub.cn/blog/482 2019-05-10 ⋅ 3617 ⋅ 1 ⋅ 1
## 1. Filter, KeepFilters KeepFilters的用法与Filter类似,只不过需要配套Calculate或者CalculateTable函数使用。 |函数名称| 语法结构| 效率| |------|------|------| |Filter | Filter( Table, FilterExpression ) | 一般| |KeepFilters| KeepFilters ( Ex...

如何处理按列排序引起的问题 by PowerPivot工坊 PowerPivot工坊

https://pbihub.cn/blog/484 2019-05-13 ⋅ 2826 ⋅ 1 ⋅ 0
![](http://p1.pstatp.com/large/pgc-image/f89631124ea74e808450d00703d504d9) 各位周五好啊!今天我们来讲解一下如何处理按列排序引起的问题~ 现有如下各产品的销售记录表: ![file](https://pbihub.cn/uploads/images/201905/13/125/xoMJLkjds9.png) 我们...

Path 函数:按人员架构核算销售额(上篇) by PowerPivot工坊 PowerPivot工坊

https://pbihub.cn/blog/486 2019-05-14 ⋅ 2557 ⋅ 1 ⋅ 1
![](http://p1.pstatp.com/large/pgc-image/f89631124ea74e808450d00703d504d9) 嗨~小伙伴们! 今天这篇文章将讨论一个按照人员组织结构来核算销售额的情景,也就是说,我们要计算的是,每个用户核算业绩的销售额等于其本身的实际销售额,加上人员架构中其全部下属...

按人员架构核算销售额(下篇) by PowerPivot工坊 PowerPivot工坊

https://pbihub.cn/blog/490 2019-05-16 ⋅ 2519 ⋅ 2 ⋅ 1
![](http://p1.pstatp.com/large/pgc-image/f89631124ea74e808450d00703d504d9) 在上期的《Path函数:按人员架构核算销售额(上篇)》一文中,我们介绍了一个利用Path和Pathcontains,再配合in函数的思路,来按照组织架构核算每一个人销售额的方法。但是其中的 Pathc...

可视化 KPI Indicator:趋势和颜色警示 by PowerPivot工坊 PowerPivot工坊

https://pbihub.cn/blog/493 2019-05-21 ⋅ 2893 ⋅ 0 ⋅ 0
![](http://p1.pstatp.com/large/pgc-image/f89631124ea74e808450d00703d504d9) 今天和大家分享一个带有颜色警示功能、趋势图和偏差值的关键绩效指标可视化视觉:KPI Indicator。这款简单高效的可视化很适用于目标与当前实际完成情况场景的分析。先看下直接出图的效...

DATESINPERIOD:计算过去某段时间的指标 by PowerPivot工坊 PowerPivot工坊

https://pbihub.cn/blog/495 2019-05-23 ⋅ 3098 ⋅ 0 ⋅ 0
![](http://p1.pstatp.com/large/pgc-image/f89631124ea74e808450d00703d504d9) 在商业场景中,有时会需要计算过去某段时间的指标,以此来预测未来的情况。比如用过去三个月的销售均值预测未来一个月的销售额,用其和未来月份的目标值做对比。 那么怎么计算过去三个...

如何使用 DAX 函数计算上年值 by PowerPivot工坊 PowerPivot工坊

https://pbihub.cn/blog/496 2019-05-24 ⋅ 4013 ⋅ 0 ⋅ 0
![](http://p1.pstatp.com/large/pgc-image/f89631124ea74e808450d00703d504d9) <br/> 工坊的小伙伴们,周五好啊!关于同期的计算是一个老生常谈的问题,今天我们来看一下计算上年值的几个DAX函数吧~ <br/> # ** 数据准备** 我们虚拟从2018年1月至2019年4月...

Power BI日常小技巧 by PowerPivot工坊 PowerPivot工坊

https://pbihub.cn/blog/508 2019-06-04 ⋅ 3311 ⋅ 0 ⋅ 0
![](http://p1.pstatp.com/large/pgc-image/f89631124ea74e808450d00703d504d9) 各位好,今天我们来介绍一下两个小技巧:快速获取日期中的年、季、月、日以及Time Passed的计算。已经知道的小伙伴顺便复习一下,初次接触的小伙伴赶紧掏出小本本记一下吧~ # **Pa...

Power Query 小攻略:图书在架率表格全自动更新 by PowerPivot工坊 PowerPivot工坊

https://pbihub.cn/blog/511 2019-06-11 ⋅ 3608 ⋅ 1 ⋅ 0
![](http://p1.pstatp.com/large/pgc-image/f89631124ea74e808450d00703d504d9) 各位好啊,今天这篇文章主要给大家介绍一个矩阵表格全自动更新的攻略。我们最后可以实现全自动更新的表格如下图: ![file](https://pbihub.cn/uploads/images/201906/11/125/A3cbT...